
“Doubt is not a pleasant condition, but certainty is absurd.” Voltaire (1770)
Every year I find myself thinking about some version of this note…and I am willing to bet that each of you have some of the same thoughts!
Not because the facts change — they rarely do — but because the experience of living through market volatility has a way of making even familiar things feel new again. Markets have an uncanny ability to feel most uncomfortable precisely when history tells us they are behaving most normally.
When markets pull back, the headlines get louder, the commentary gets more confident, and everyone suddenly seems to know exactly what comes next. Which is interesting, because the honest answer is that nobody does. And if someone claims they do, I usually assume they’re either guessing or selling something.
The uncertainty is not a flaw in markets. It’s part of the design. So, this note is partly for clients, but if I’m being honest, it’s also a reminder to myself about something that history has demonstrated repeatedly: market pullbacks are normal.
The First Pullback of the Year
With widespread uncertainty on how long the conflict in the Middle East may last, the S&P 500 just experienced its first pullback of more than 5% this year.
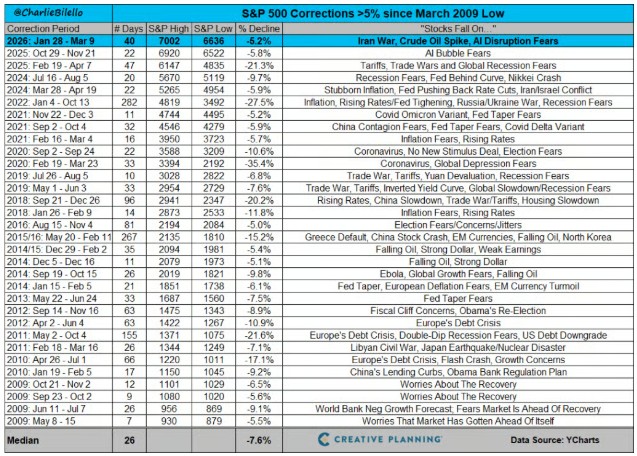
A 5% decline always gets attention. But what’s easy to forget is how frequently these moves occur: since the market bottomed in March of 2009, there have been more than thirty declines of 5% or greater along the way.
Thirty.
That works out to roughly two pullbacks per year, even during one of the strongest long-term market advances in history. This is a useful reminder that volatility and long-term growth are not opposites. Instead, they tend to arrive together.
When Fear Spikes
Below is a complete list of the largest weekly spikes in the VIX, often called the market’s “fear gauge.” Guess what: last week’s was the largest spike ever recorded.
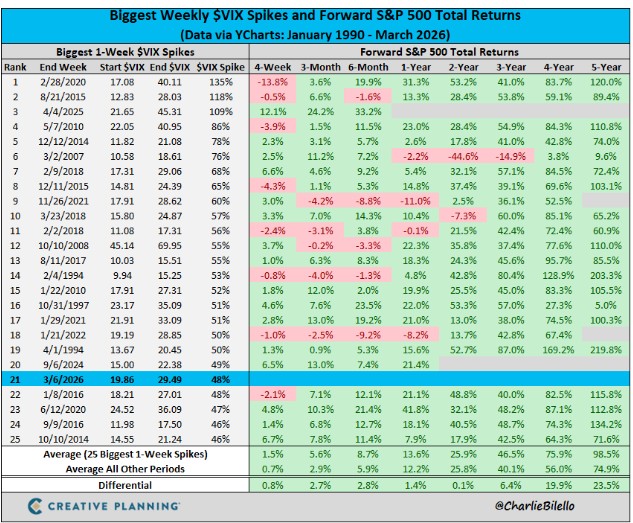
Historically, when fear spikes like that, something interesting tends to happen afterward: markets have often delivered above-average forward returns in the years that follow.
That doesn’t mean markets rebound immediately. Sometimes they do. Sometimes they don’t. But it does highlight one of the more uncomfortable truths about investing: the periods that feel the most chaotic are often the moments when the long-term opportunity is quietly improving.
Unfortunately, markets don’t send a notification when that process begins—but we all wish it did!
Not All Declines Are the Same
When markets fall, the question that matters most isn’t whether they’re falling. It’s why. Broadly speaking, market declines tend to come from two different places.
Structural economic problems
These are the events that tend to cause deeper and longer bear markets. They involve issues within the economic or financial system itself — things like:
- banking crises
- severe recessions
- credit bubbles unwinding
- systemic financial stress
These events can affect earnings, employment, credit availability, and economic growth all at once. When the economic foundation is under pressure, markets can take time to recover. The financial crisis of 2008 is the most obvious recent example.
Geopolitical shocks
The second category involves geopolitical events — wars, international conflicts, political disruptions, and sudden global tensions. These events are unsettling and unpredictable. But historically they have tended to produce shorter-lived market disruptions than structural economic crises.[2] The chart below, shows stock market returns following the start of major military conflicts:
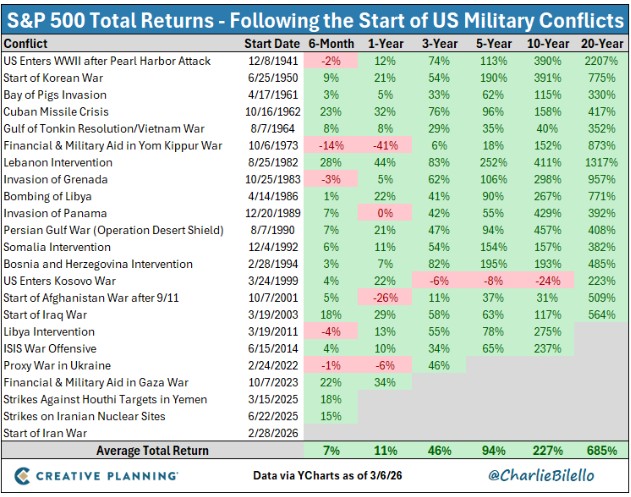
The short-term outcomes vary widely, but over longer periods markets have generally continued to rise. That outcome reflects a simple reality: wars eventually end, economies adjust, and businesses continue doing what they’ve always done — producing goods, providing services, and trying to grow.
None of that removes the human tragedy of conflict, of course. But it does help explain why markets often prove more resilient than expected.
Why Stocks Offer Higher Returns
Over many decades, equities have produced approximately 10% annual returns, compared with roughly 4–5% for bonds and 1-3% for cash.
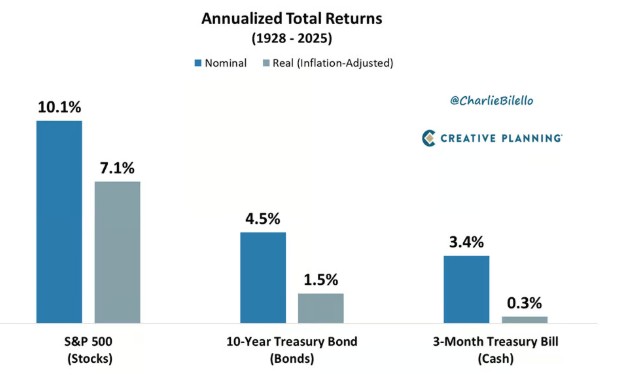
That gap is not accidental. Stocks come with uncertainty. They come with volatility. They come with periods — sometimes uncomfortable ones — when prices move sharply in the wrong direction. If markets were perfectly stable, the long-term return advantage of equities would likely disappear. The lawyer in me thinks about it this way: the volatility is simply part of the contract.
The World Always Looks Chaotic in Real Time
The final chart I want to share may be the most instructive. It should look familiar, because Eric used a similar one in his last commentary—and he borrowed it from Shiv. I am sure Rob and Mat have their favourite versions too!
It shows the long-term growth of $1 invested in the stock market, with major global crises marked along the timeline. Unfortunately, the list is long. At the time, each of these moments felt overwhelming.
Yet when viewed through the lens of decades, they appear as interruptions in a much longer story of economic progress and corporate growth.
History has a way of smoothing out events that felt anything but smooth at the time.
A Final Reminder (Mostly for Myself)
So, this note is a quiet reflection: markets will pull back; headlines will become dramatic; predictions will become confident; and the future will feel unusually uncertain — even though uncertainty was there all along.
But history does suggest something fairly consistent: the investors who tend to be rewarded over time are the ones who remain patient while everyone else is trying to predict the next headline.
Which is a useful thing for me to remember — especially when the news cycle starts getting loud again.
-Chris
[1] The charts in this note are all compiled from Charlie Bilello’s “The Week in Charts” released on March 11th.
[2] Schwab Brokerage, “Geopolitical Risk is Evolving: what you need to know”, February 9, 2026.

