
Retirement Expenses & Withdrawal Strategies Mini-Series – Part 1 of 2
As any retiree or near retiree will tell you, there are three factors that go into determining whether you can afford to retire. First, the amount of your savings. Second, the amount that you want or need to spend throughout your remaining life expressed as an annual “budget”. And finally, how much wealth you would like to have when you pass away. This last part has two factors baked into it: a margin of error in case you live longer than you expect; and protection in case spending and/or portfolio performance don’t match with your estimations.
Combining all these variables isn’t easy and requires continuous review and constant adjustment. But, in Canada and the US, many retirees are spending less than they can afford, which means that they are either working longer than they need to; or alternatively, they can afford to enjoy more of their wealth in retirement. [1]
In this communication we will look at challenges with estimating spending habits. In two weeks, we will look at the challenges with traditional withdrawal rules.
The “Spending Smile”
When most of us envision our retirement expenses, it looks something like this [2] :
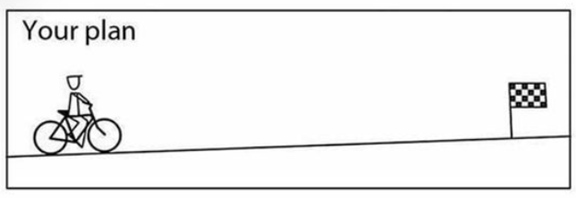
We stop working, start drawing on our savings, and then try to maintain a constant standard of living for the next 25 or 30…or 40…years. Traditional planning tools, and indeed almost all decumulation software, are built on this assumption of smooth, inflation-adjusted spending.
As if!
Let’s try this on for size:

The reality of how Canadians actually spend in retirement is far more interesting — and far more useful for planning. Economists call it the “retirement spending smile.”
Where the Smile Comes From
The term comes from U.S. research, most notably the work of David Blanchett in his 2014 study “Exploring the Retirement Consumption Puzzle”. By analyzing thousands of retired households, Blanchett found that spending tends not to remain constant. Instead, it follows a smile-shaped curve: higher in the early years of retirement, lower in the middle, and rising again later in life, largely due to health and support care costs.
This concept — the “go-go, slow-go, no-go” stages — has become widely recognized in retirement planning circles. The smile challenges the flat-line model: people rarely spend the same way at 60, 70, 80 or 90.
Let me put that in perspective. Imagine a retiree couple who wants $120k of annual after-tax spending at age 60. In the early years, spending on discretionary items (like travel, for example) makes up a large part of that spending. However, as retirement continues, spending becomes more focused on the essentials and the total household budget drops. [3] Using Canadian averages, their actual spending (ignoring inflation) might look like this in today’s dollars:
- Age 60: $120,000
- Age 70: $108,000
- Age 80: $96,000
- Age 90: $111,500
Canadian Evidence for the Smile
While the term originated in the U.S., Canadian data strongly support the pattern, although the part of the smile at the end of a Canadian’s life may be slightly off-kilter as our public health care funding will offset some of the spending impacts. [4]
The C.D. Howe Institute notes a “strong tendency for personal consumption to decline with advancing age,” estimating real declines of 1–2% per year [until early 80s] in discretionary categories for retirees. [5]
Taken together, these studies give us strong Canadian evidence for the spending smile: retirees spend more at the start, taper through the middle, and then often face a late-life increase.
Why the Smile Matters
Why does this matter for you? Because many withdrawal strategies assume constant inflation-adjusted spending.
If your true pattern looks more like a smile, then following a flat-line rule may cause you to underspend when you have the most energy and freedom to enjoy it.
Looking Ahead
In this first part of our commentary, we’ve looked at the evidence for the retirement spending smile. In Part 2, we’ll examine how this reality collides with traditional withdrawal strategies, especially the famous “4% Rule.”
——————————

